Weekly monetization reports at Thirdverse — SQL pulls, annotated charts, visual-merchandising decisions grounded in data instead of taste.
Role
Sole UX designer + de-facto monetization analyst
Team
Reports delivered to the X8 team weekly
Platform
Internal — data from in-engine telemetry
Tools
SQL (data pulls), Google Sheets / Slides (presentation), Figma (annotations)
Duration
Late 2023 – Dec 2024, weekly cadence
Status
Adopted as part of team rhythm; informed live store decisions
Setup
Owning the in-game shop database (previous case study) put me close to the data. Close enough that running my own queries against in-engine telemetry was a smaller leap than waiting on someone else to pull numbers. I started writing weekly reports for the X8 team — what sold, what didn't, what the store was doing that we hadn't designed it to do.
Most UX designers don't run their own BI. I did, because the data was right there.

What I did — 01
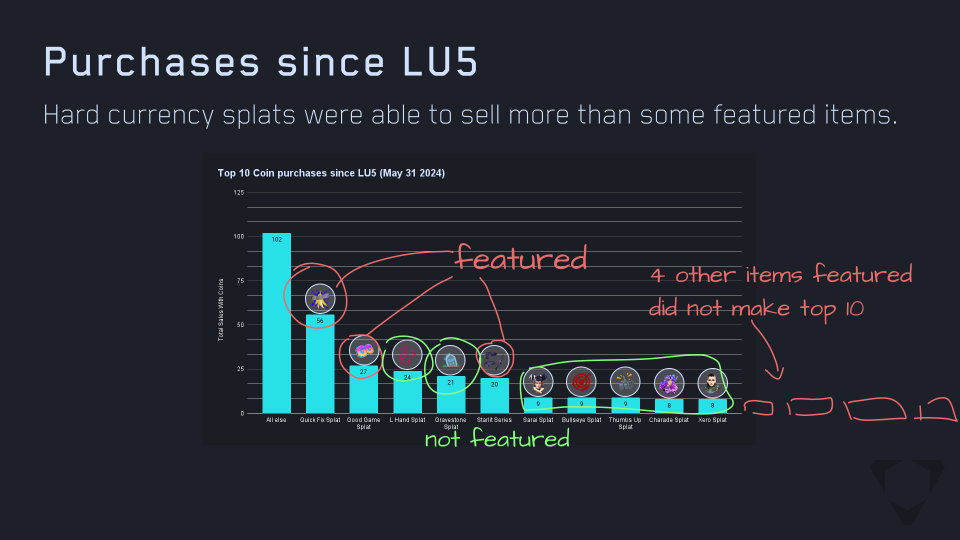
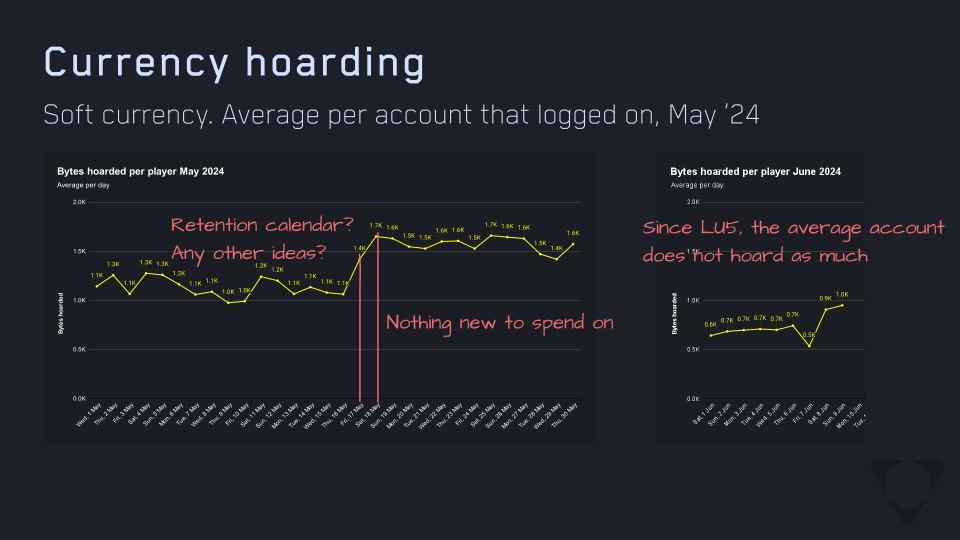
Every week, a deck. SQL pulls against in-engine data covering top sellers, currency hoarding (Bytes and Coins), store rotation performance, and item-class comparisons over rolling 7- and 30-day windows.
What I did — 02
Having a close eye on monetization reports allowed us to see interesting patterns. Items with teal or green palettes, for example, consistently outsold comparable items at similar rarity and stat lines. The pattern was real, not a one-week blip. This allowed us to confidently give our artists better direction.
COnclusion
The reports were used to make all sorts of monetization-related decisions. Everything from how we handle currency hoarding, to what themes we should be aiming for, sales and offers we could work on etc.
Conclusion
II wrote the queries, drew the conclusions, and adjusted the design. Their interplay allowed me to deliver better designs in the IAP store, the artists better direction for making purchasable items, the marketing team better opportunities for upsells.